Warning: Some posts on this platform may contain adult material intended for mature audiences only. Viewer discretion is advised. By clicking ‘Continue’, you confirm that you are 18 years or older and consent to viewing explicit content.
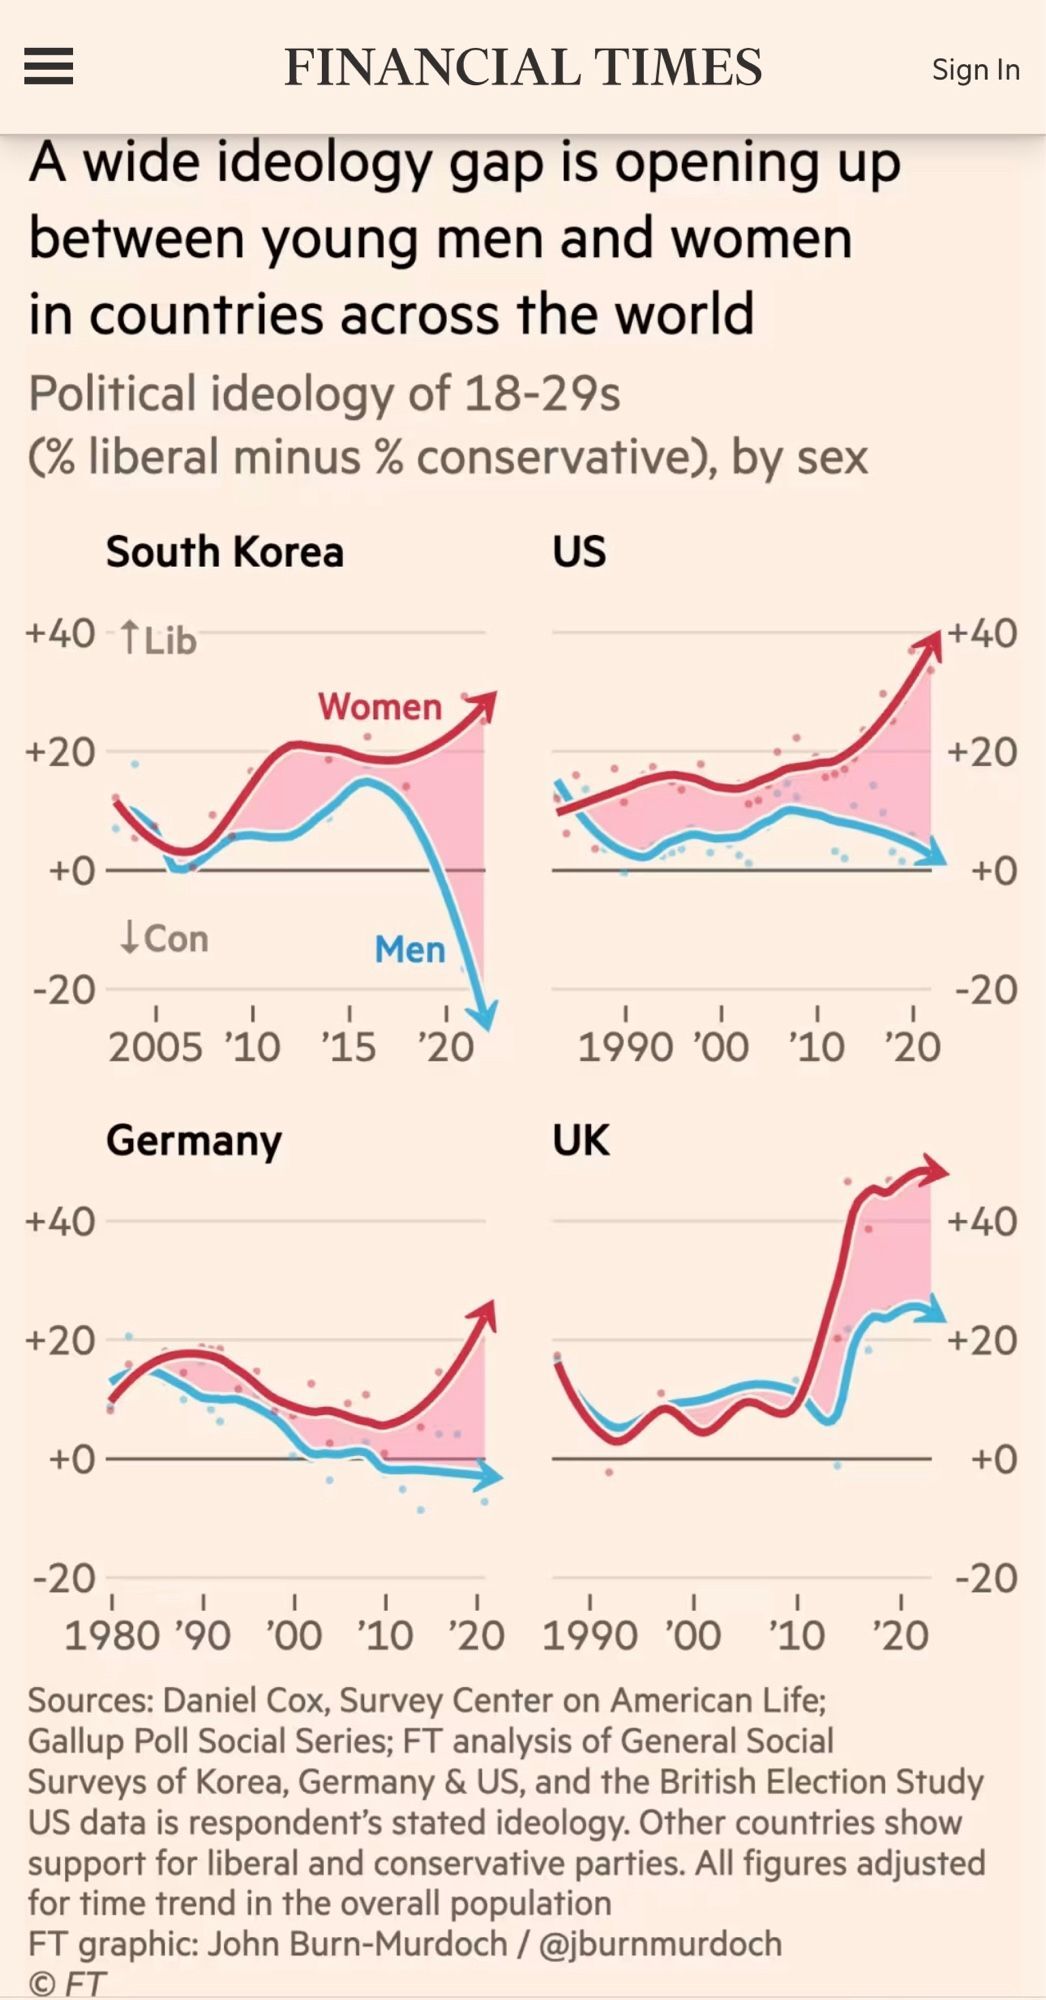
I personally don’t like how the top left one starts at 2005, unlike every other graph, but they all have the same x scale. (I nitpick things sometimes)
I personally don’t like how the top left one starts at 2005, unlike every other graph, but they all have the same x scale. (I nitpick things sometimes)