Warning: Some posts on this platform may contain adult material intended for mature audiences only. Viewer discretion is advised. By clicking ‘Continue’, you confirm that you are 18 years or older and consent to viewing explicit content.
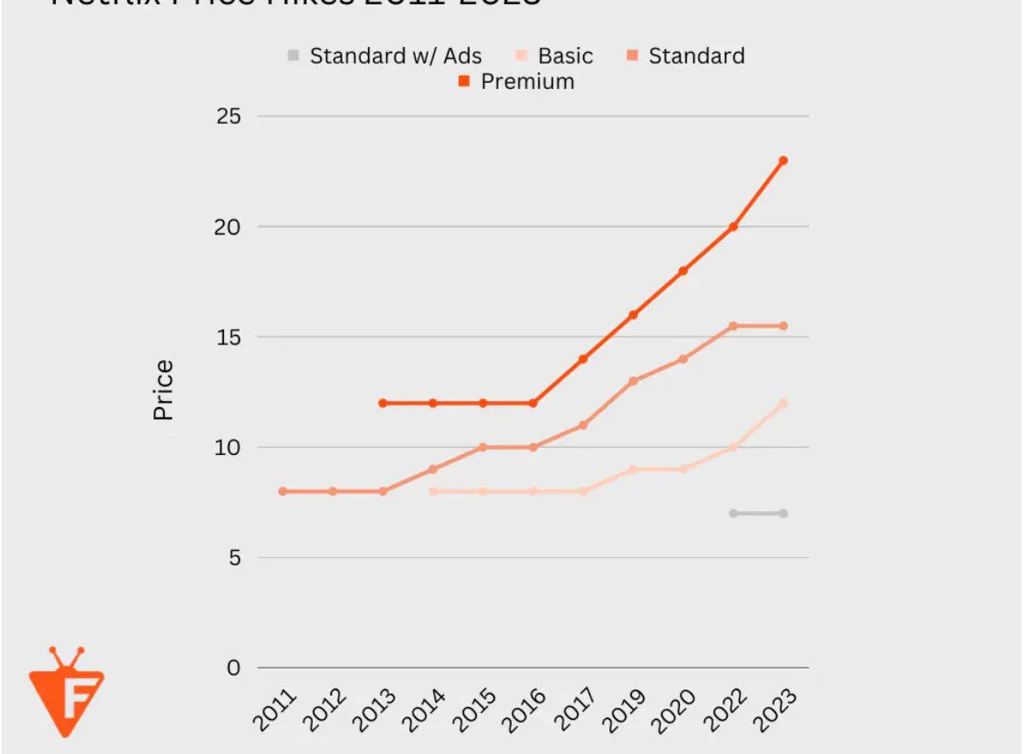
Then why are 2012 and 2016 included? It’s extremely confusing to have a line graph over time where intervals of time are missing, even if you clearly call attention to it, which they don’t here.
Then why are 2012 and 2016 included? It’s extremely confusing to have a line graph over time where intervals of time are missing, even if you clearly call attention to it, which they don’t here.