Warning: Some posts on this platform may contain adult material intended for mature audiences only. Viewer discretion is advised. By clicking ‘Continue’, you confirm that you are 18 years or older and consent to viewing explicit content.
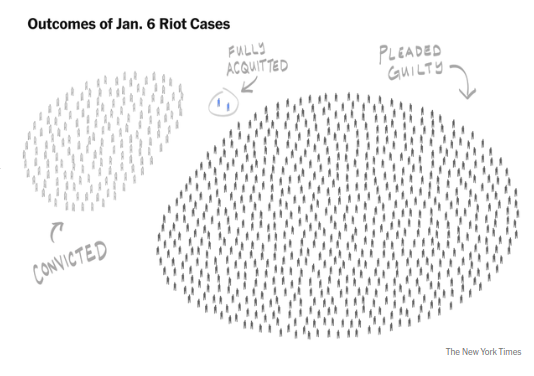
Assuming they had a proper criteria/methodology rather than just anecdotes and the like, it’s data. It’s a weird visualization of that data, but it’s still data.
Phrased another way, using only the data provided by the drawing, you could turn this into more common presentations. This includes a spreadsheet, pie chart, or a bar graph.