Warning: Some posts on this platform may contain adult material intended for mature audiences only. Viewer discretion is advised. By clicking ‘Continue’, you confirm that you are 18 years or older and consent to viewing explicit content.
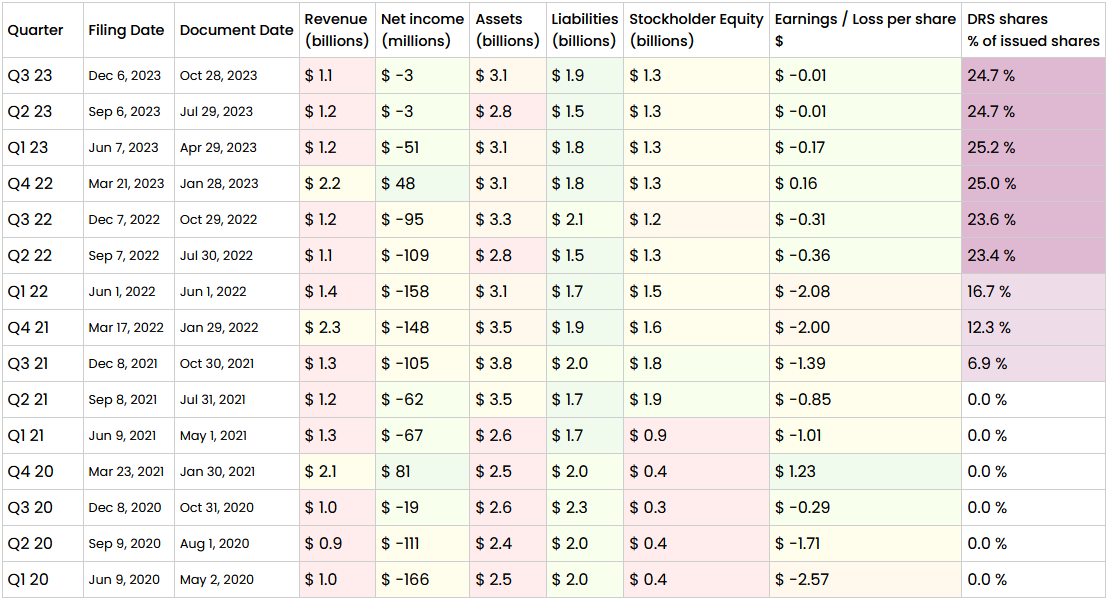
Great chart –– it lets people make their own judgments based on the facts! I will give the bull case, and if you disagree, then feel free to give the bear case. For the latest quarter, stockholder equity is $1.3 billion, and net loss is $3 million. $1.3 billion / ($3 million / year) = 433.3 years. This is sufficient runway to turn the company around.
Revenue may be down $3 million, but cash and cash equivalents increased $15 million (from $1.195 billion to $1.210 billion). Doesn’t this mean they’re actually gaining money, just not from direct sales?