Hello everyone! I’m using a TIG stack (Telegraf, InfluxDB, Grafana) in Docker to monitor my server and I keep running into the same issues.
When the Telegraf container gets updated (removed and recreated), the Hostname changes. This leads to Grafana to split the data (best case) or show no data at all (worst case) since it was told to show a specific field which is named after the host.
Now, I have tried regexing the column (example: /uptime_format/ in flux) but I’m a noob at both regex and flux so that doesn’t work either.
I think I might need to set the hostname in the telegraf container but I thought I’d ask if anyone else solved this problem before. :)
Thank you for reading.
You must log in or register to comment.
Are you using docker compose? You can set the container hostname for telegraf, https://community.influxdata.com/t/incorrect-hostname-picked-up-by-telegraf-docker-container/24469/6
Yes I am. I now chose to just change it in the config, restarted telegraf and it works now. Thanks :)
With Prometheus I would add a section to the scrap config to rewrite the labels attached to each metric. Does such a thing exist for telegraf? I’ve never used it.
Or could you change the grafana query to just aggregate the values for all pods in that deployment?
Thanks for answering so fast! :)
I’m not deep enough to know if telegraf can do this. It has “plugins” that work okayish. Not a lot to configure. I suppose I could start going into the nitty gritty but I would abolutely love to avoid it. I have like 10+ services running on my server and I can’t go this deep without an IT team and with a job. :)
In this special case, it is uptime I’m after and influxdb throws a table at me that looks like this:
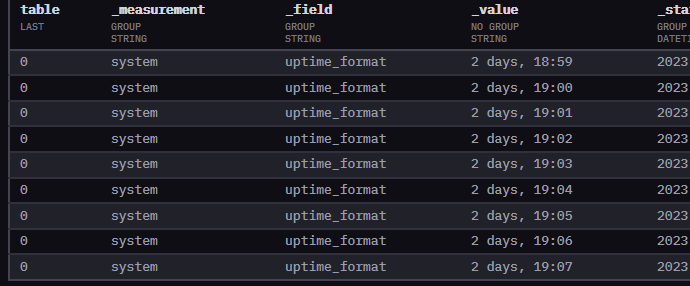
then I use this to get the data into grafana:
from(bucket: "telegraf")
  |> range(start: v.timeRangeStart, stop: v.timeRangeStop)
  |> filter(fn: (r) => r["_measurement"] == "system")
  |> filter(fn: (r) => r["_field"] == "uptime_format")
  |> aggregateWindow(every: v.windowPeriod, fn: last, createEmpty: false)
  |> yield(name: "last")
And what turns up is this:
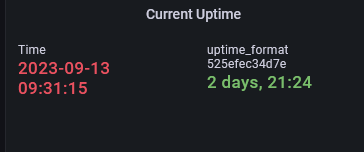
Now, having worked with SQL before, there is a way to just show the “2 days, 18:02” bit instead of two values and without manually selecting the host each time in SQL, I just don’t know how to do it in flux.
I hope this makes sense. Have a good one. :)
You don’t do it in flux, you do it in the panel options in Grafana.
On your original question you can set the Telegraf hostname in the config, for docker stuff I just use
omit_hostname = true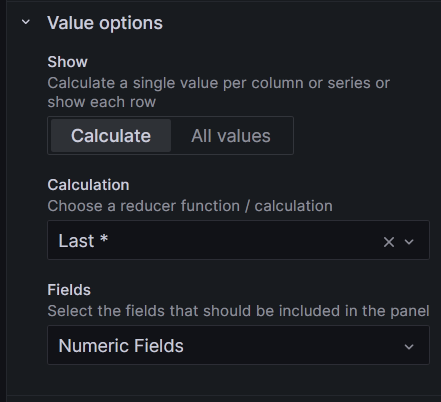
Okay! Thanks for explaining! Thats very helpful.